Bitcoin market cycles — the four phases, the halving clock, and where we are now
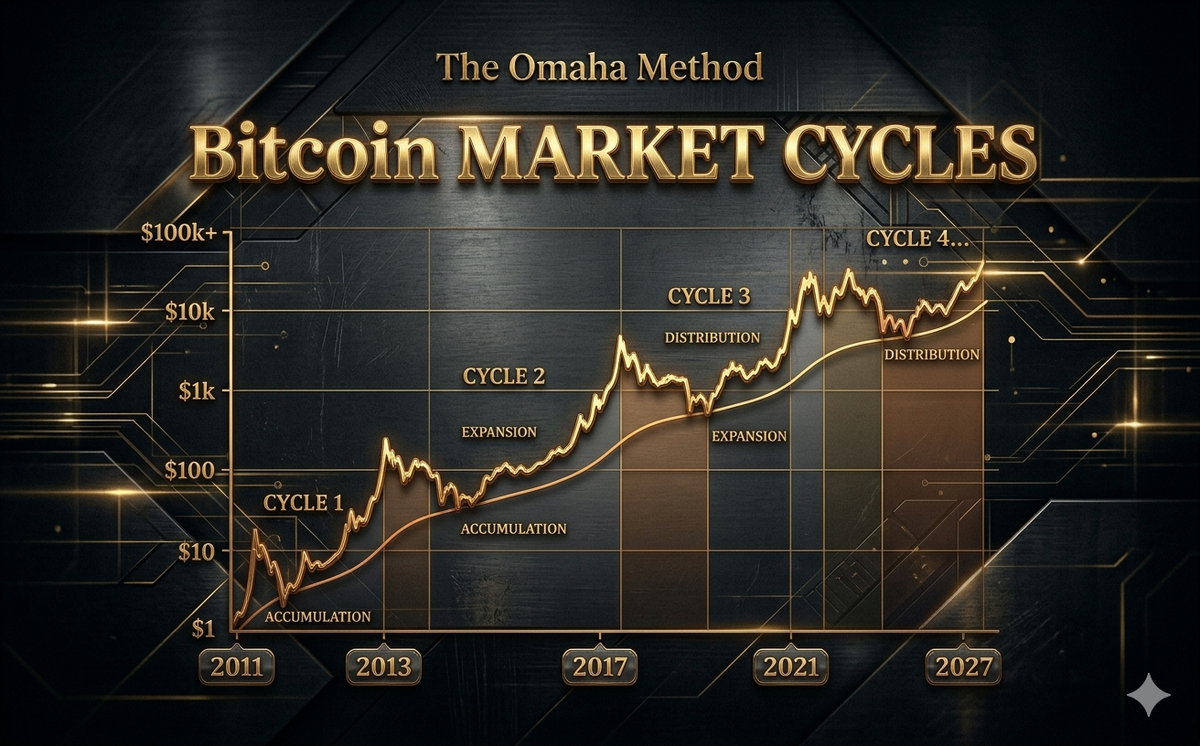
Bitcoin has followed a 4-year cycle anchored to the halving since 2012. Four phases: accumulation, bull market, distribution, bear market. The April 2024 halving puts the peak window at Q4 2025 – Q2 2026. Here is the complete cycle analysis with historical data and where we stand now.
Bitcoin market cycles —
the four phases, the halving clock, and where we are now
I cicli di mercato Bitcoin —
le quattro fasi, il clock dell'halving e dove siamo ora
Les cycles de marché Bitcoin —
les quatre phases, l'horloge du halving et où nous en sommes
Bitcoin has followed a consistent 4-year cycle anchored to its halving mechanism since 2012. Understanding the four phases — accumulation, bull market, distribution, bear market — is the most useful analytical framework for any Bitcoin investor. Here is the complete data across all four cycles.
Bitcoin ha seguito un ciclo consistente di 4 anni ancorato al suo meccanismo di halving dal 2012. Capire le quattro fasi — accumulazione, bull market, distribuzione, bear market — è il framework analitico più utile per qualsiasi investitore in Bitcoin. Ecco i dati completi su tutti e quattro i cicli.
Bitcoin a suivi un cycle cohérent de 4 ans ancré à son mécanisme de halving depuis 2012. Comprendre les quatre phases — accumulation, marché haussier, distribution, marché baissier — est le cadre analytique le plus utile pour tout investisseur en Bitcoin. Voici les données complètes sur les quatre cycles.
Source: @100trillionUSD on X · #Bitcoin #HalvingCycle #StockToFlow #MarketCycle
Fonte: @100trillionUSD su X · #Bitcoin #CicloHalving #StockToFlow #CicloDiMercato
Source : @100trillionUSD sur X · #Bitcoin #CycleHalving #StockToFlow #CycleDeMarché
PlanB — the creator of the Stock-to-Flow model — has been tracking this pattern since 2019. His observation is not a coincidence: the halving creates a predictable supply shock every four years, and the market has consistently repriced Bitcoin upward in the 12–18 months following each halving. Understanding this framework does not guarantee returns — but it is the single most powerful lens for interpreting Bitcoin's price action.
PlanB — il creatore del modello Stock-to-Flow — traccia questo pattern dal 2019. La sua osservazione non è una coincidenza: l'halving crea uno shock dell'offerta prevedibile ogni quattro anni, e il mercato ha costantemente riprezzato Bitcoin verso l'alto nei 12-18 mesi successivi a ogni halving. Capire questo framework non garantisce rendimenti — ma è la lente singola più potente per interpretare l'azione dei prezzi di Bitcoin.
PlanB — le créateur du modèle Stock-to-Flow — suit ce modèle depuis 2019. Son observation n'est pas une coïncidence : le halving crée un choc d'offre prévisible tous les quatre ans, et le marché a constamment re-pricé Bitcoin à la hausse dans les 12 à 18 mois suivant chaque halving. Comprendre ce cadre ne garantit pas les rendements — mais c'est l'objectif unique le plus puissant pour interpréter l'action des prix de Bitcoin.
The four phases — anatomy of a Bitcoin cycle
Le quattro fasi — anatomia di un ciclo Bitcoin
Les quatre phases — anatomie d'un cycle Bitcoin
Source: @saylor on X · #Bitcoin #MarketCycle #HODL #LongTerm #DigitalGold
Fonte: @saylor su X · #Bitcoin #CicloDiMercato #HODL #LungoTermine #OroDigitale
Source : @saylor sur X · #Bitcoin #CycleDeMarché #HODL #LongTerme #OrNumérique
Source: @HODL15Capital on X · #Bitcoin #MarketCycle #Halving #ZoomOut
Fonte: @HODL15Capital su X · #Bitcoin #CicloDiMercato #Halving #ZoomOut
Source : @HODL15Capital sur X · #Bitcoin #CycleDeMarché #Halving #ZoomOut
Where we are now — the 2024–2028 cycle
Dove siamo ora — il ciclo 2024–2028
Où nous en sommes — le cycle 2024-2028
| Cycle event | Evento del ciclo | Événement du cycle | Historical avg | Media storica | Moyenne historique | 2024–2028 projection | Proiezione 2024–2028 | Projection 2024-2028 |
|---|---|---|---|---|---|---|---|---|
| Halving date | Data halving | Date du halving | Every ~4 years | Ogni ~4 anni | Tous les ~4 ans | April 19, 2024 ✓ | ||
| Cycle peak | Picco del ciclo | Sommet du cycle | 12–18 months post-halving | 12-18 mesi post-halving | 12-18 mois post-halving | Apr–Oct 2025 window (estimated) | Finestra Apr–Ott 2025 (stimato) | Fenêtre Avr–Oct 2025 (estimé) |
| Bear market bottom | Minimo del bear market | Creux du marché baissier | 12–18 months post-peak | 12-18 mesi post-picco | 12-18 mois après le sommet | 2026–2027 (projected) | 2026–2027 (proiettato) | 2026-2027 (projeté) |
| Next halving | Prossimo halving | Prochain halving | ~4 years after previous | ~4 anni dopo il precedente | ~4 ans après le précédent | ~2028 | ||
| Block reward at next halving | Ricompensa blocco al prossimo halving | Récompense de bloc au prochain halving | — | 1.5625 BTC |
The cycle is a framework, not a forecast
Il ciclo è un framework, non una previsione
Le cycle est un cadre, pas une prévision
1. The cycle provides a probability distribution, not a price prediction. The halving model predicts the approximate timing and direction of Bitcoin's major moves — not the precise price or date. Using it as a precision tool is a mistake. Using it as a probabilistic lens for position sizing and risk management is rational.
1. Il ciclo fornisce una distribuzione di probabilità, non una previsione di prezzo. Il modello halving prevede il timing approssimativo e la direzione dei movimenti principali di Bitcoin — non il prezzo preciso o la data. Usarlo come strumento di precisione è un errore. Usarlo come lente probabilistica per il dimensionamento delle posizioni e la gestione del rischio è razionale.
1. Le cycle fournit une distribution de probabilité, pas une prévision de prix. Le modèle halving prédit le timing approximatif et la direction des principaux mouvements de Bitcoin — pas le prix précis ou la date. L'utiliser comme outil de précision est une erreur. L'utiliser comme lentille probabiliste pour le dimensionnement des positions et la gestion des risques est rationnel.
2. Dollar-cost averaging (DCA) removes the need to time the cycle. An investor who bought $100 of Bitcoin every month for the past 5 years — through bull and bear — has an average cost significantly below the current price, regardless of when they started. DCA eliminates the dangerous psychological pressure of trying to call the top or the bottom.
2. Il dollar-cost averaging (DCA) elimina la necessità di fare timing del ciclo. Un investitore che ha acquistato $100 di Bitcoin ogni mese negli ultimi 5 anni — attraverso bull e bear — ha un costo medio significativamente inferiore al prezzo attuale, indipendentemente da quando ha iniziato. Il DCA elimina la pericolosa pressione psicologica di cercare di chiamare il top o il bottom.
2. La moyenne d'achat (DCA) élimine le besoin de timer le cycle. Un investisseur qui a acheté 100 $ de Bitcoin chaque mois pendant les 5 dernières années — à travers les marchés haussiers et baissiers — a un coût moyen nettement inférieur au prix actuel, quel que soit le moment où il a commencé. Le DCA élimine la dangereuse pression psychologique d'essayer d'appeler le sommet ou le creux.
3. The most important question is not "where are we in the cycle?" — it is "can I hold through the bear market?". Every cycle bottom has been followed by a new all-time high. But the bear markets are severe: 70–85% drawdowns, lasting 12–18 months. If you cannot psychologically and financially survive an 80% drawdown without selling, your Bitcoin position is sized incorrectly — regardless of where we are in the cycle.
3. La domanda più importante non è "dove siamo nel ciclo?" — è "riesco a resistere attraverso il bear market?". Ogni minimo del ciclo è stato seguito da un nuovo massimo storico. Ma i bear market sono severi: drawdown del 70-85%, della durata di 12-18 mesi. Se non riesci psicologicamente e finanziariamente a sopravvivere a un drawdown dell'80% senza vendere, la tua posizione in Bitcoin è dimensionata in modo errato — indipendentemente da dove siamo nel ciclo.
3. La question la plus importante n'est pas « où en sommes-nous dans le cycle ? » — c'est « puis-je tenir pendant le marché baissier ? ». Chaque creux de cycle a été suivi d'un nouveau record historique. Mais les marchés baissiers sont sévères : des drawdowns de 70 à 85 %, durant 12 à 18 mois. Si vous ne pouvez pas psychologiquement et financièrement survivre à un drawdown de 80 % sans vendre, votre position Bitcoin est mal dimensionnée — quel que soit l'endroit où nous en sommes dans le cycle.
This article is for informational and educational purposes only. It does not constitute financial, tax or investment advice. All cycle projections are based on historical patterns and should not be relied upon as price predictions. Past performance does not guarantee future results.
Questo articolo ha finalità esclusivamente informative ed educative. Non costituisce consulenza finanziaria, fiscale o di investimento. Tutte le proiezioni del ciclo sono basate su pattern storici e non dovrebbero essere usate come previsioni di prezzo. I rendimenti passati non garantiscono risultati futuri.
Cet article est à titre exclusivement informatif et éducatif. Il ne constitue pas un conseil financier, fiscal ou d'investissement. Toutes les projections de cycle sont basées sur des modèles historiques et ne doivent pas être utilisées comme prévisions de prix. Les performances passées ne garantissent pas les résultats futurs.